PRTG Network Monitor is a server up-time and utilization, network monitoring, and bandwidth usage software package for server infrastructure. It can monitor and classify bandwidth usage in a network using SNMP, packet sniffing, and Netflow. The following guide will walk you through this integration.
In Splunk On-Call
From the Splunk On-Call web portal, click Integrations
From the list of integrations options, select the PRTG (webhook) integration option.
On the resulting page, copy the Service API Endpoint to the clipboard. Be sure to replace the “$routing_key” part of this endpoint with the actual routing key you intend to use.
In PRTG Network Monitor
On your server, navigate to C:\Program Files (x86)\PRTG Network Monitor\Notifications\EXE and create a file named “prtgtovictorops.ps1”. In the file, paste the following code and save the updated file.
Param(
 [string]$API_URL,
 [string]$MessageType,
 [string]$SiteName,
 [string]$Device,
 [string]$DeviceId,
 [string]$Name,
 [string]$Status,
 [string]$Down,
 [string]$DateTime,
 [string]$LinkDevice,
 [string]$Message
)

Add-Type -AssemblyName System.Web.Extensions
function ConvertTo-Json ([Object] $value)
{
 [System.Web.Script.Serialization.JavaScriptSerializer] $jsSerializer = New-Object 'System.Web.Script.Serialization.JavaScriptSerializer'
 $jsSerializer.Serialize($value)
}

function setMessageType ([string] $inputString)
{
 If ($inputString -like "Up*")
 {
 return 'recovery'
 }
 elseif ($inputString -like "Down*")
 {
 return 'critical'
 }
 elseif ($inputString -like "Warning*")
 {
 return 'warning'
 }
 else
 {
 return 'info'
 }
}

$postVOAlert = ConvertTo-Json(@{
message_type = SetMessageType($Status);
entity_id = $DeviceId;
entity_display_name = $Device;
monitoring_tool = "PRTG";
site_name = $SiteName;
link_device = "<$($LinkDevice)|$($Device) $($Name)>";
status = "$($Status) $($Down) on $($DateTime)";
state_message = $Message;
})

[Net.ServicePointManager]::SecurityProtocol = [Net.SecurityProtocolType]::Tls12
$postVOAlert | Out-File -FilePath vo.log

[System.Net.WebClient] $webclient = New-Object 'System.Net.WebClient'
$webclient.Headers.Add("Content-Type","application/json")
$webclient.UploadData($API_URL, [System.Text.Encoding]::UTF8.GetBytes($postVOAlert)) | Out-File -FilePath vo.log -Append
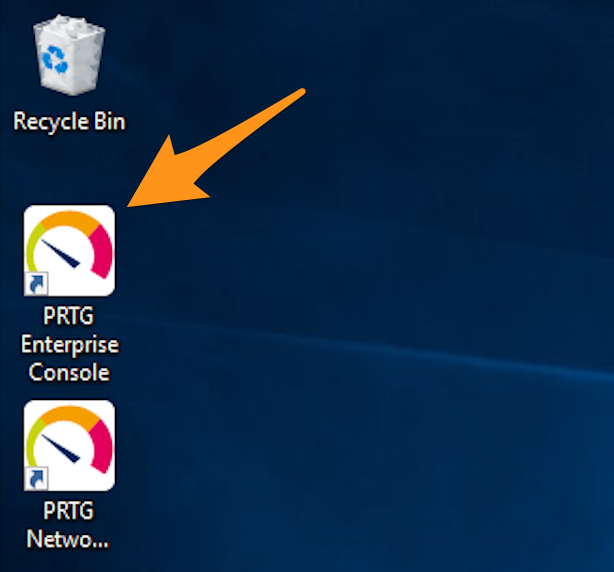
From your server’s desktop, open PRTG Enterprise Console.
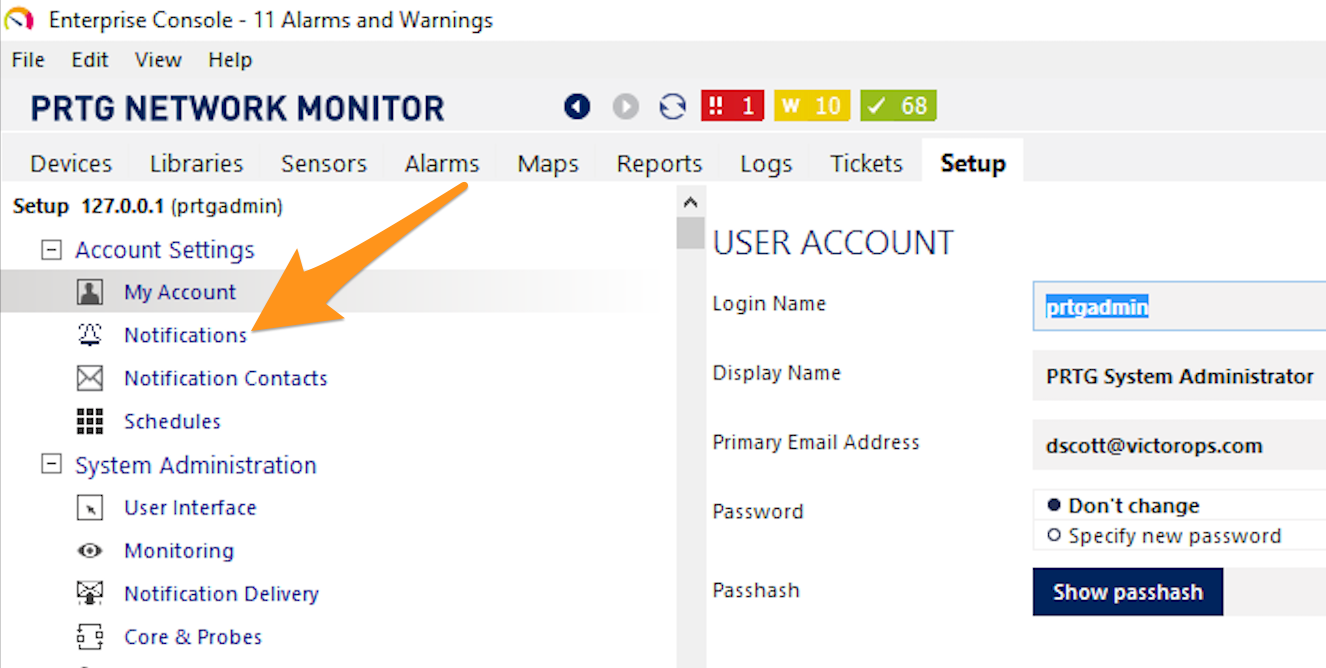
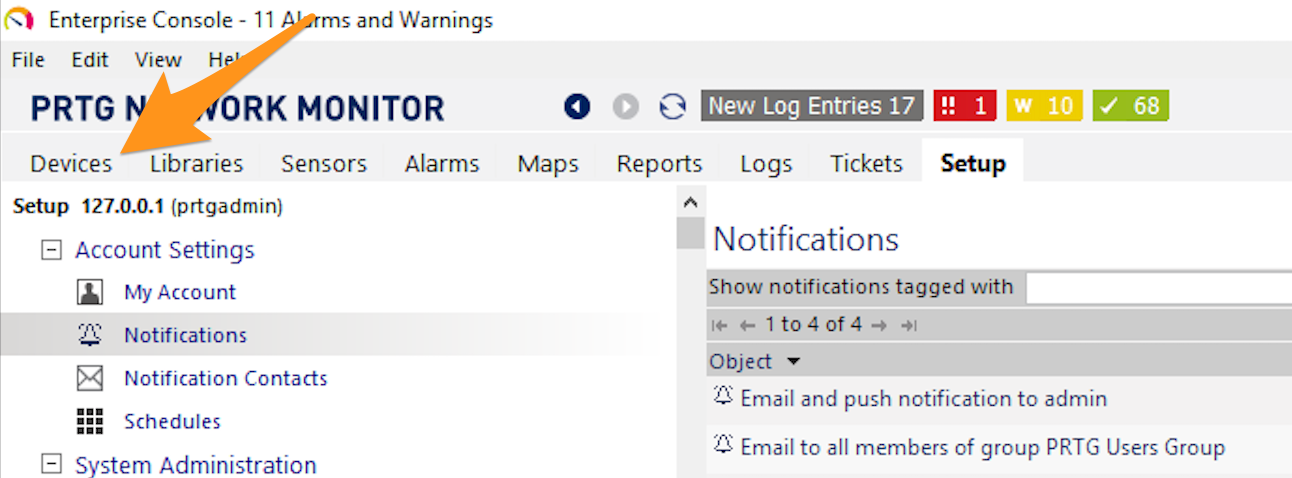
In the PRTG Enterprise Console, select the Setup tab.

Select Notifications under “Account Settings” on the left side of the screen.
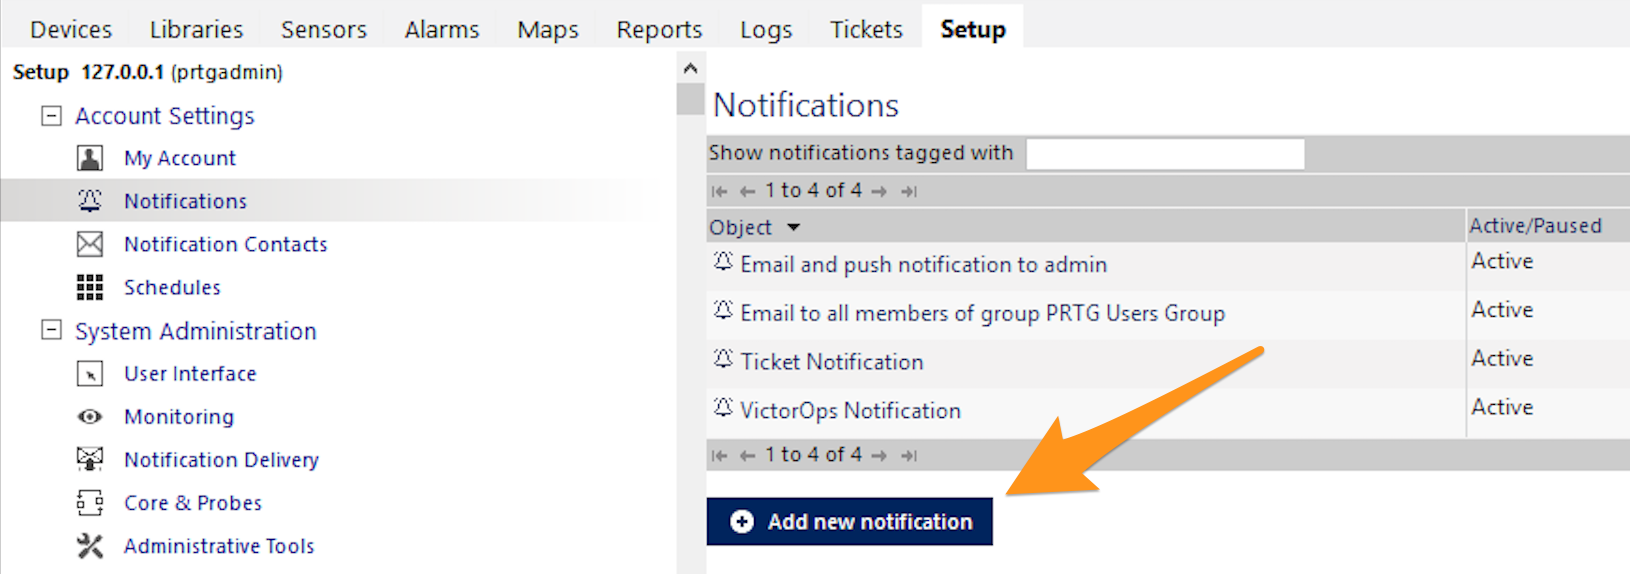
Click Add new notification.
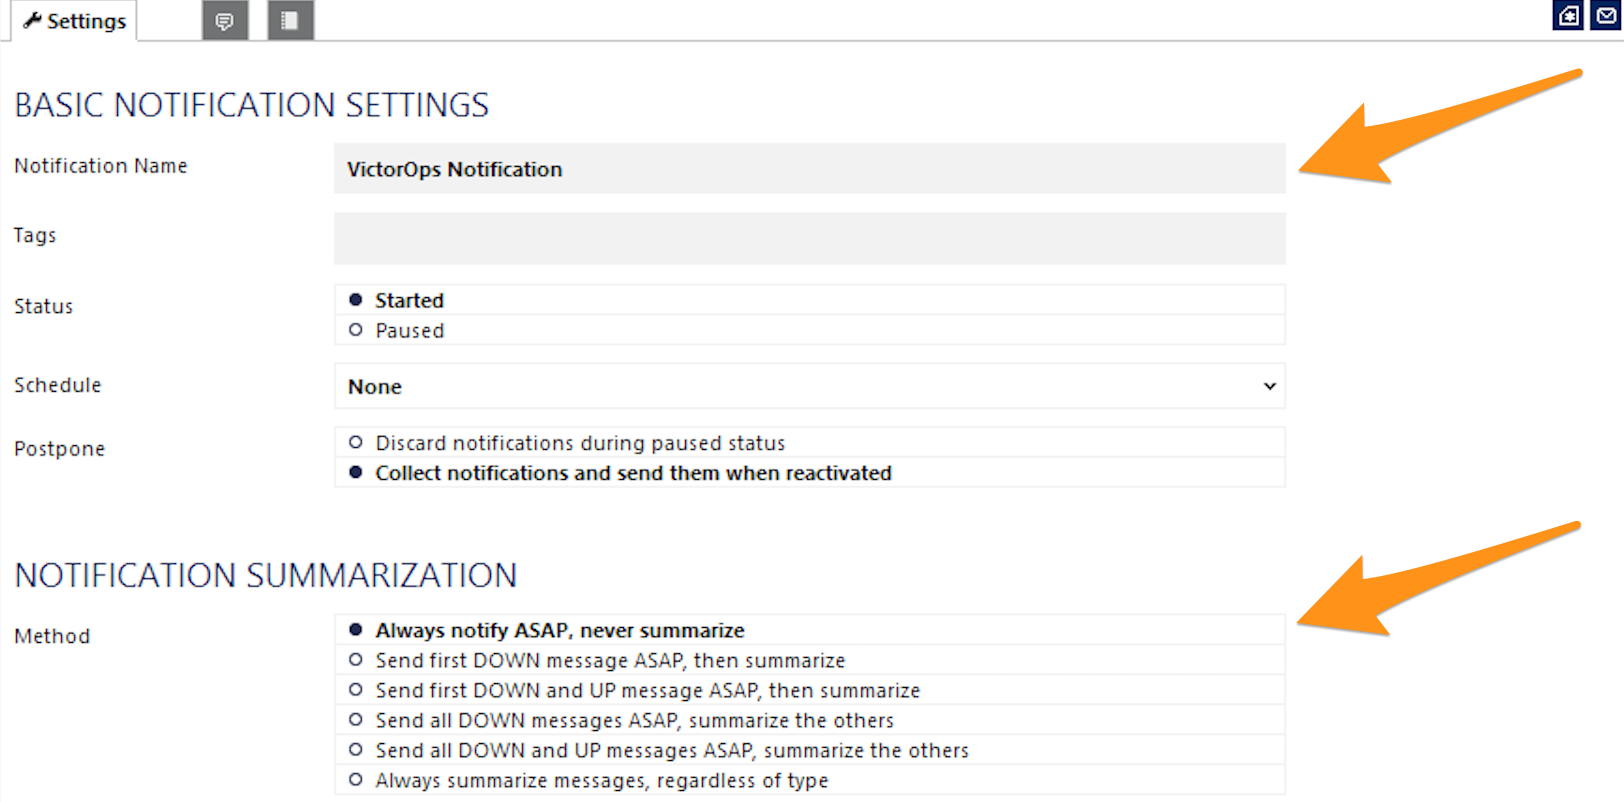
Enter “Splunk On-Call Notification” in the “Notification Name” field, then select Always notify ASAP, never summarize for “Method”.
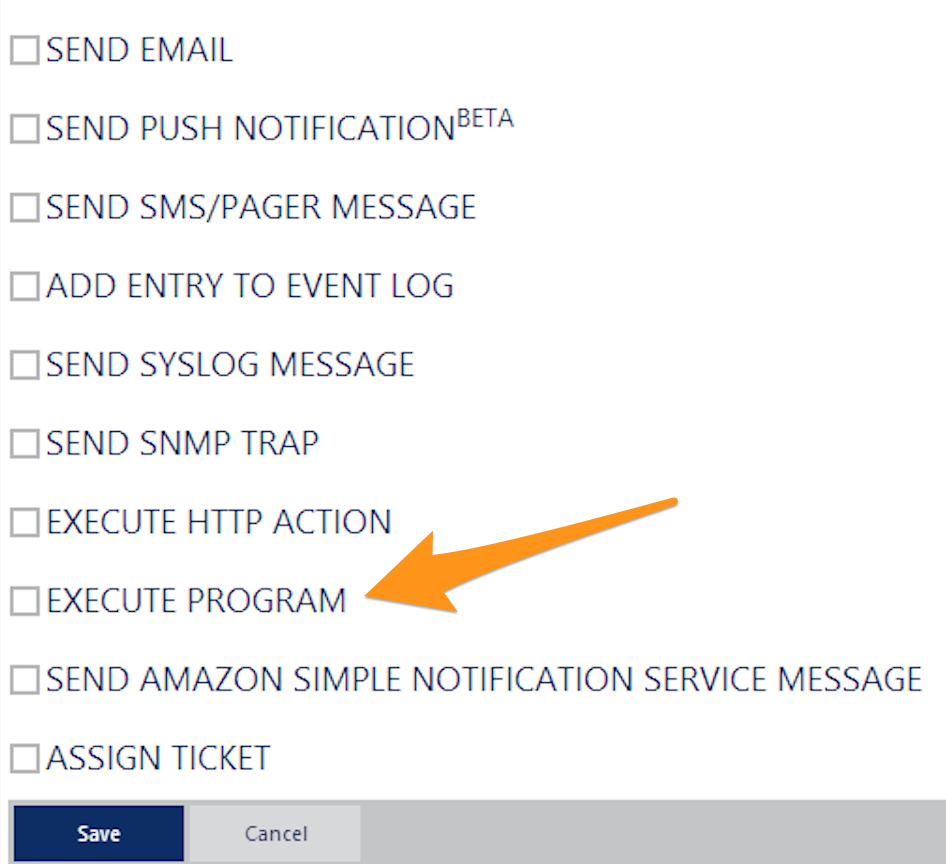
Scroll down, then select EXECUTE PROGRAM.
Select Prtgtovictorops.ps1 from the “Program File” dropdown menu, then paste the following into the “Parameter” field replacing URL_to_notify with your “URL to notify” from the “In Splunk On-Call” section.
-API_URL 'URL_to_notify' -SiteName '%sitename' -Device '%device' -DeviceId '%deviceid' -Name '%name' -Status '%status' -Down '%down' -DateTime '%datetime' -LinkDevice '%linkdevice' -Message '%message'
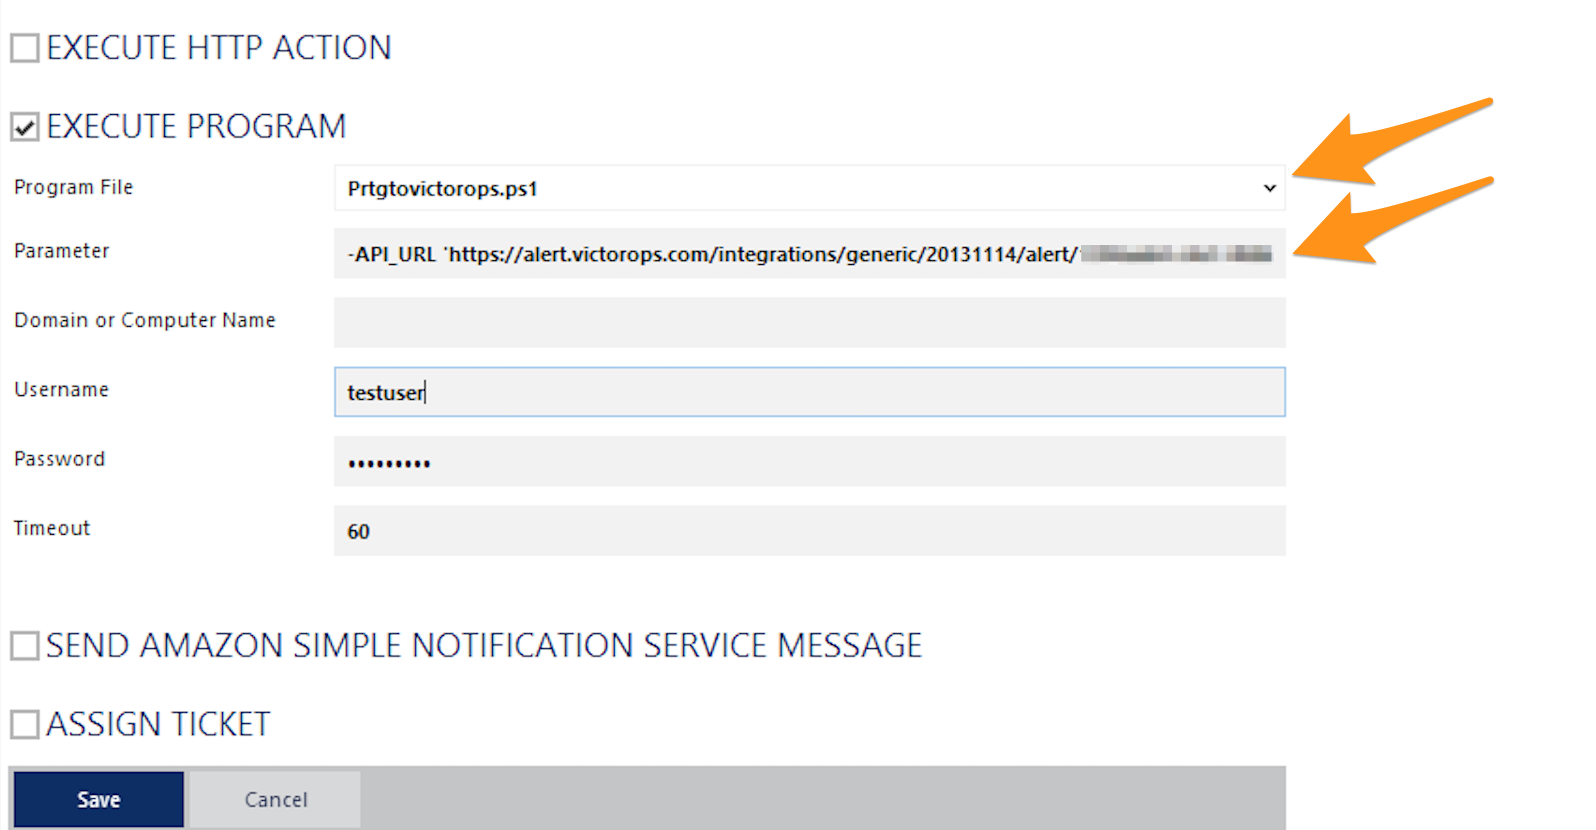
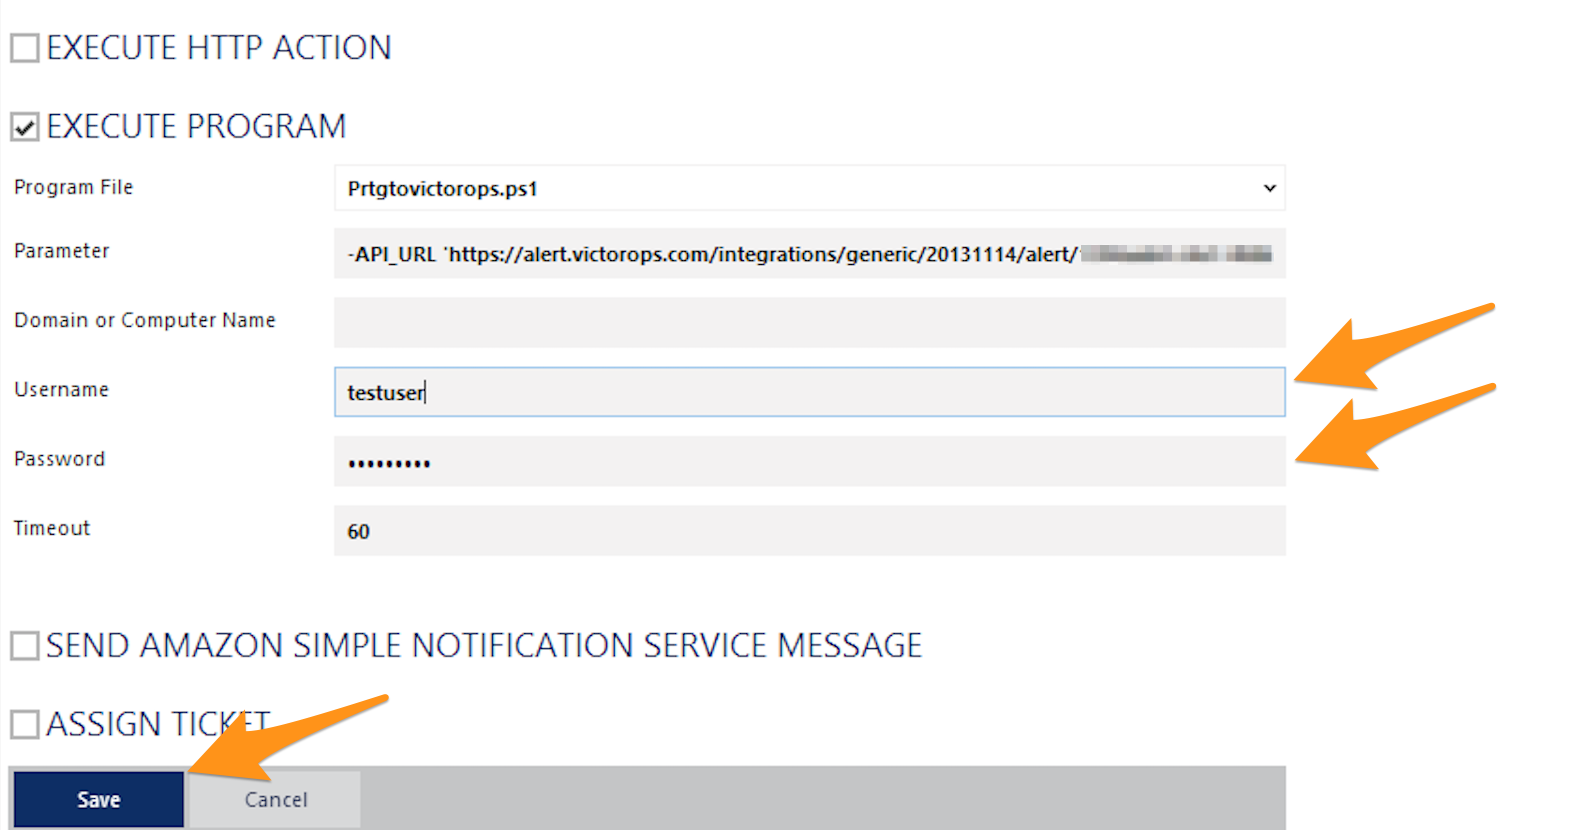
Enter the credentials for the Windows administrator that originally installed PRTG, then click Save.
Click on the Test link next to “VictorOps Notification”.
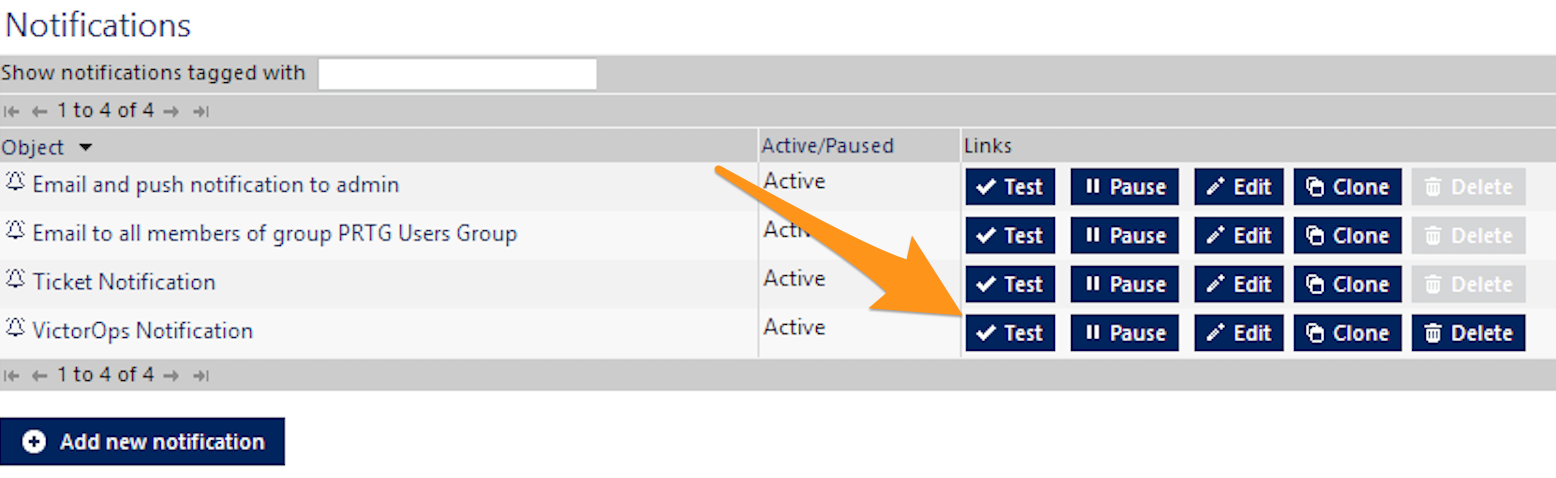
Click OK in “Notification Test Results”.
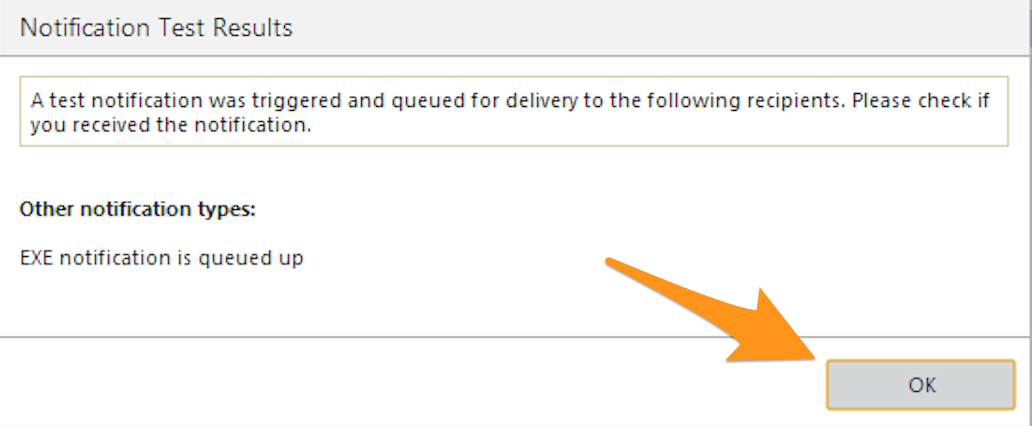
You should see an alert show up in your Splunk On-Call timeline.
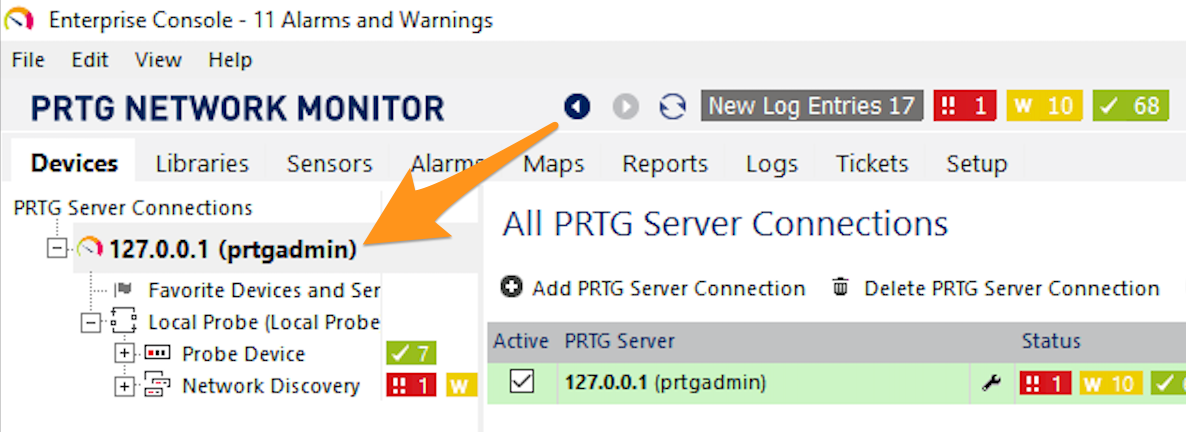
Select the Devices tab.
Select the parent PRTG server connection.
Select the Notifications tab.
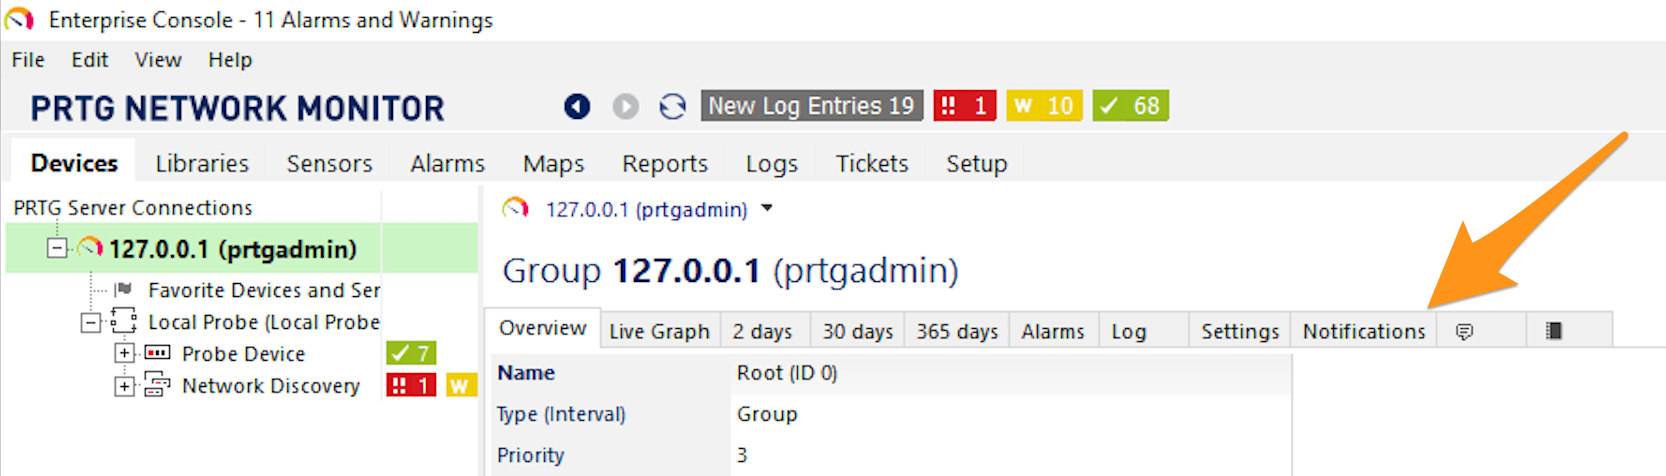
Click Add State Trigger.
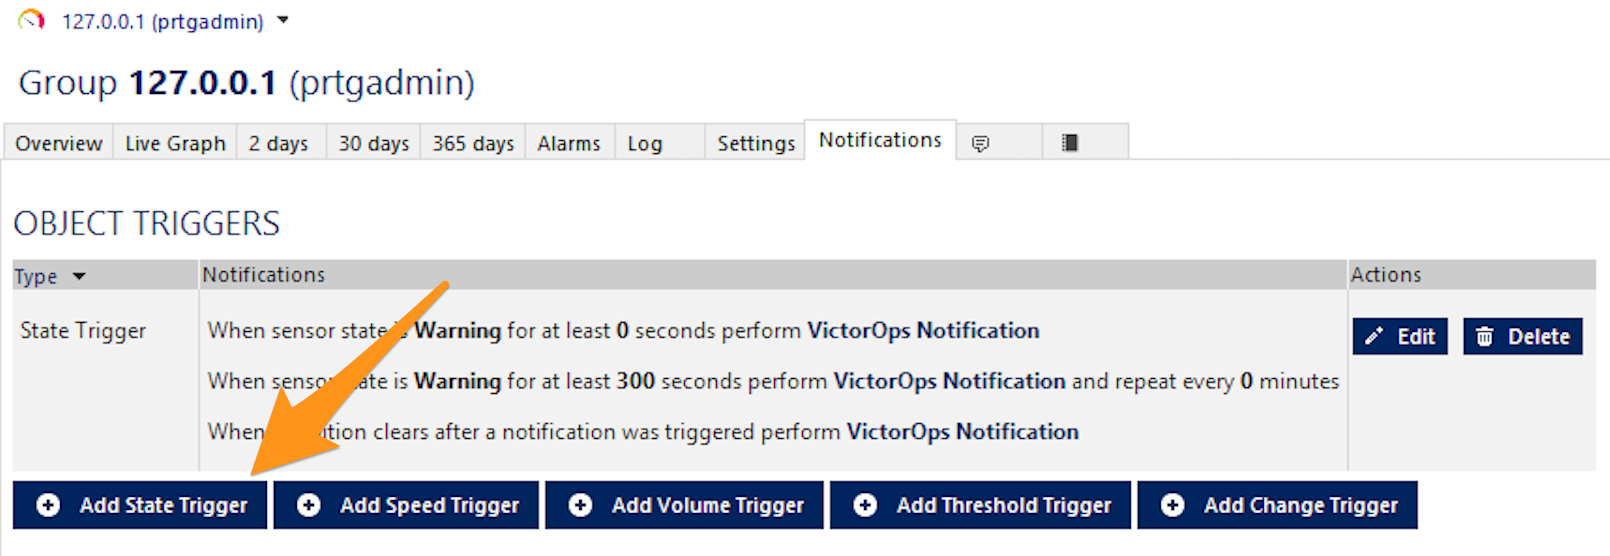
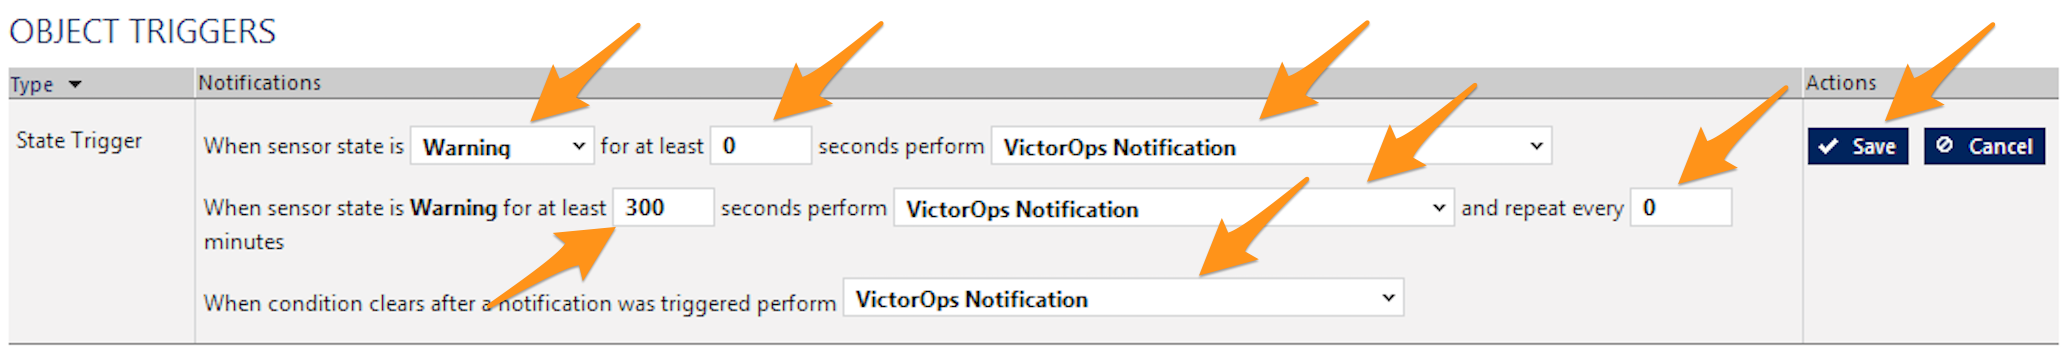
In this example, the trigger is set up for the “Warning” sensor state. You can modify these settings as you desire or create other triggers for when sensors are “Down” for example, just make sure to select VictorOps Notification from the three dropdown menus after “perform”, then click Save.
You have now completed setting up this integration.
Simulate an Alert
You can verify the integration by navigating to one of your sensors, right clicking one and selecting “simulate error status”. This should prompt an alert to be fired through to Splunk On-Call.
Troubleshooting
It is recommended to have the latest version of Powershell running in your PRTG environment for the integration script to work best. You can check which version of Powershell you currently have by running the following command line:
$PSVersionTable.PSVersion
If you have any questions, please contact Splunk On-Call support.