About Splunk On-Call and Elasticsearch Watcher
Elasticsearch is a distributed, RESTful search and analytics engine capable of solving a growing number of use cases. Watcher is a plugin for Elasticsearch that provides alerting and notification based on changes in your data. The following guide will walk you through this integration. The Splunk On-Call and Elasticsearch Watcher integration allows you to alert on cluster and index events. Track network activity, monitor your infrastructure, automate and transform alerts, and communicate internally to quickly remediate any issues.
Elasticsearch Watcher and Splunk On-Call allows you to set thresholds, smart alert routing, and escalation policies to notify applicable parties when they need to be notified.
Log and Cluster Health Monitoring and Alert Routing
- In the Splunk On-Call timeline, improve system observability by taking advantage of Elasticsearch Watcher log and cluster health monitoring data
- Automate your alerts by setting thresholds on key metrics and notify applicable on-call incident managers to crucial problems
- In one single pane of glass, maintain on-call schedules, set up alert routing and escalation policies, aggregate monitoring data, and collaborate with context to quickly resolve incidents
Enable Elasticsearch Watcher in Splunk On-Call
From the Splunk On-Call web portal, navigate to Integrations >> 3rd Party Integrations >> Elasticsearch Watcher and click Enable Integration. Copy the Service API Key to the clipboard to use in following steps.
Using Kibana with Elasticsearch
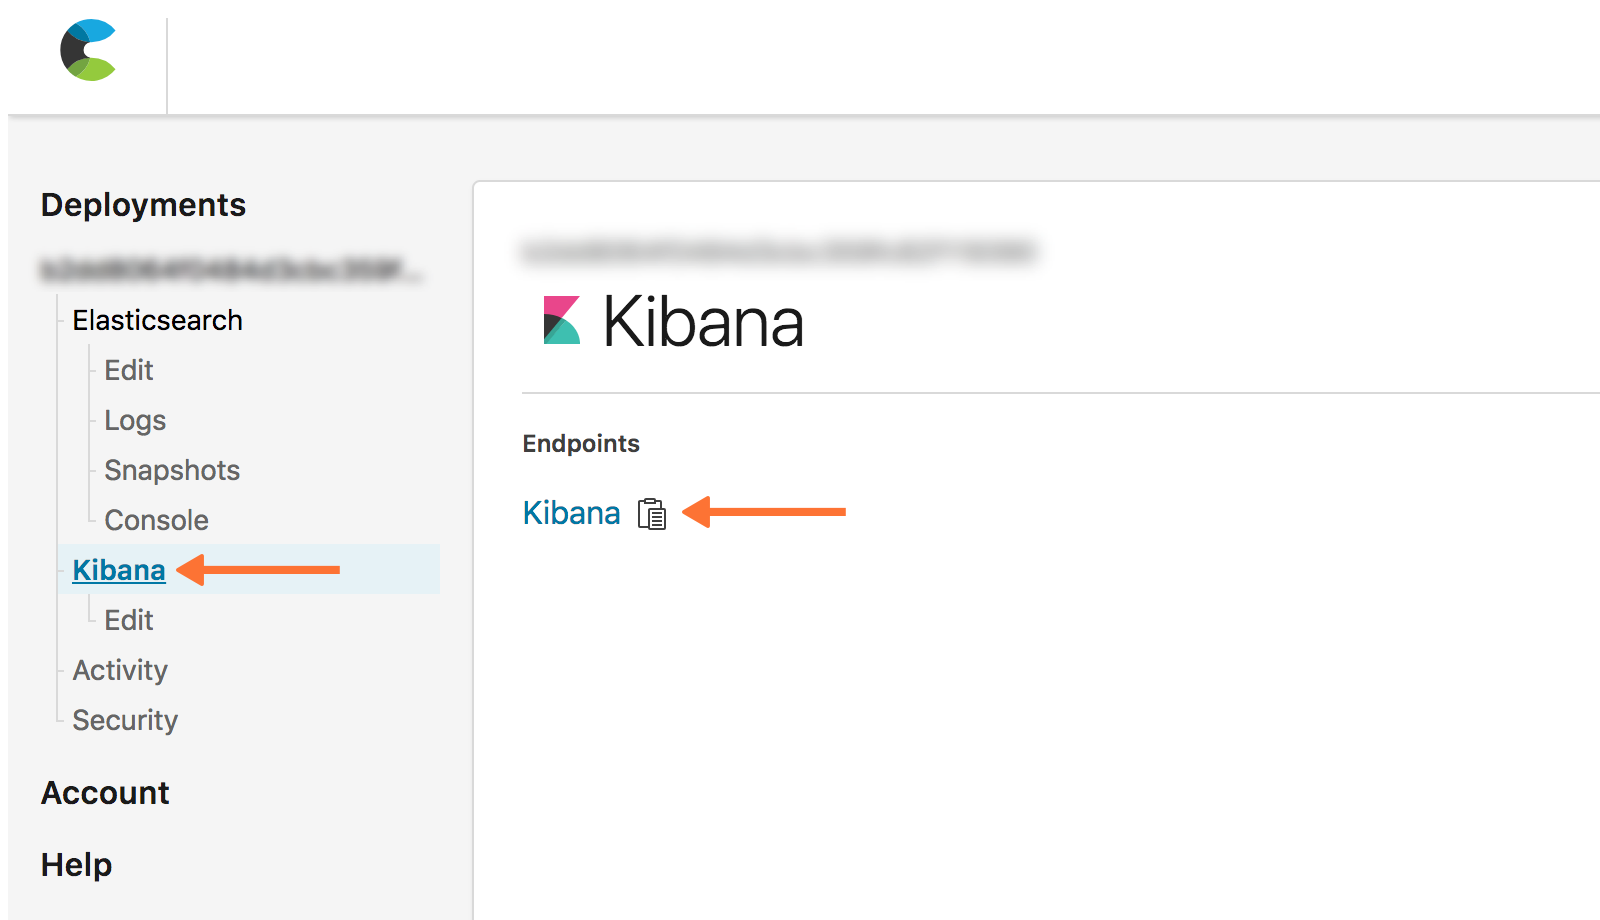
Kibana lets you visualize your Elasticsearch data and navigate the Elastic Stack, it also provides a friendly user interface by which you can configure your Watch. From the Elastic Cloud homepage, navigate to Kibana — you may need to first enable it.

Log in to Kibana and navigate to Management >> Watcher then create a new Advanced Watch.
Under this watch, configure the action object to look like the following. Note that triggers, inputs or conditions will be up to you to decide, based off of the types of alerts you wish to send to Splunk On-Call . Be sure to replace $service_api_key and $routing_key with the appropriate values for your organization.
"actions": {
    "victorops": {
      "webhook": {
        "scheme": "https",
        "host": "alert.victorops.com",
        "port": 443,
        "method": "post",
        "path": "/integrations/generic/20131114/alert/$service_api_key/$routing_key",
        "params": {},
        "headers": {
          "Content-type": "application/json"
        },
        "body": "{\"message_type\": \"CRITICAL\",\"monitoring_tool\": \"Elastic Watcher\",\"entity_id\": \"{{ctx.id}}\",\"entity_display_name\": \"{{ctx.watch_id}}\",\"state_message\": \"{{ctx.watch_id}}\",\"elastic_watcher_payload\": {{#toJson}}ctx.payload{{/toJson}} }"
      }
    }
  }
Configure in Elasticsearch Watcher
From the command line, verify that Watcher is running on your server:
curl -XGET 'http://localhost:9200/_watcher/stats?pretty'
You should get a response showing "watcher_state": "started":
{
 "watcher_state" : "started",
 "watch_count" : 5,
 "execution_thread_pool" : {
 "queue_size" : 0,
 "max_size" : 10
 },
 "manually_stopped" : false
}
Send a PUT request to the watch API to register a new watch or update an existing watch. This example uses curl to create a watch that sends an alert to Splunk On-Call every 60 seconds so that you can confirm the integration is working. Make sure to replace $service_api_key with your Service API Key from the “In Splunk On-Call” section and to replace $routing_key with the routing key you intend to use.
curl -XPUT 'http://localhost:9200/_watcher/watch/cluster_health_watch' -d '{
 "trigger" : {
 "schedule" : { "interval" : "60s" }
 },
 "input" : {
 "http" : {
 "request" : {
 "host" : "localhost",
 "port" : 9200,
 "path" : "/_cluster/health"
 }
 }
 },
 "condition" : {
 "always" : {}
 },
 "actions" : {
 "victorops" : {
 "webhook" : {
 "scheme" : "https",
 "method" : "POST",
 "host" : "alert.victorops.com",
 "port" : 443,
 "path" : "/integrations/generic/20131114/alert/$service_api_key/$routing_key",
 "body" : "{\"message_type\": \"CRITICAL\",\"monitoring_tool\": \"Elastic Watcher\",\"entity_id\": \"{{ctx.id}}\",\"entity_display_name\": \"{{ctx.watch_id}}\",\"state_message\": \"{{ctx.watch_id}}\",\"elastic_watcher_payload\": {{#toJson}}ctx.payload{{/toJson}} }",
 "headers" : {"Content-type": "application/json"}
 }
 }
 }
}'
The “actions” section of the JSON object configures Watcher to send alerts to Splunk On-Call, the rest of the object is where you configure the conditions that trigger the alerts to be sent. Confirm that you see an alert in the Splunk On-Call timeline.
For any questions or feedback, please contact Splunk On-Call Support.